A Great new Feature in Winter ’14
There are always great new features in each of the 3 releases each year. One that was in Winter ’14 but not real obvious unless you search for it is the addition of “Report Charts” to page layouts.
This means that you can now add report charts to any existing page layout. Prior to this, you had to do some custom development.
What does this do for you? How about seeing a chart on the Account page that sums all the revenue from all Opportunities for that Account, alltime?
Or seeing a chart on the Cases object that shows the average resolution time for all Cases ever opened by that Account?
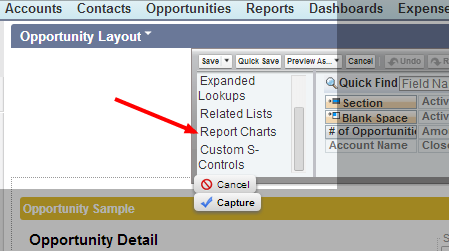
Below is a screenshot of how to find this. Just know that you have to first create the chart on a Report. Then, it will be smart enough to list the charts when you are ready to add it to the page layout.